


Document Actions
gvSIG-Desktop 1.10. Nuevas funcionalidades
The bar legend is located the Multiple Attributes section of the legend tree, and can be used to represent several attributes at once. To access it, right-click on the layer name to open the Properties, then select the Symbols tab.
The following options are available for configuring bar charts:
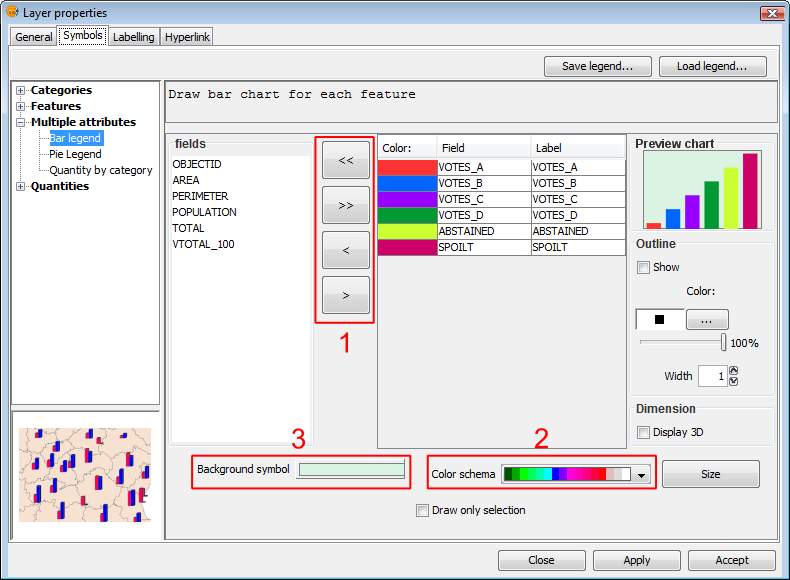
Symbols. Legend bar
Fields: You can choose which of the layer's fields to represent, provided they are numeric. With these fields you can:
- Add all fields.
- Delete all fields.
- Add the selected fields.
- Delete the selected fields.
To do this click on the buttons shown in the image above (Box 1).
Colour scheme: You can change the default colour scheme for the bars. To do this, select the desired "Colour scheme" from the drop-down list, as shown in the image above (Box 2).
Change the colour: In addition it is possible to change the colour of bars once they have been added.
Once the default colour scheme has been chosen, the colour of a bar can be changed by double-clicking on its color tile.
You can use the following dialog to select a colour sample, or set it yourself (HSB, RGB).
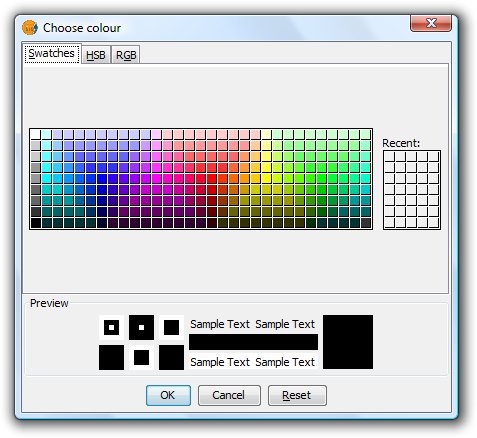
Symbols. Color Selection
Background symbol: You can change the symbol of the background geometries by clicking on the symbol to open the symbol editor (pictured above, Box 3).
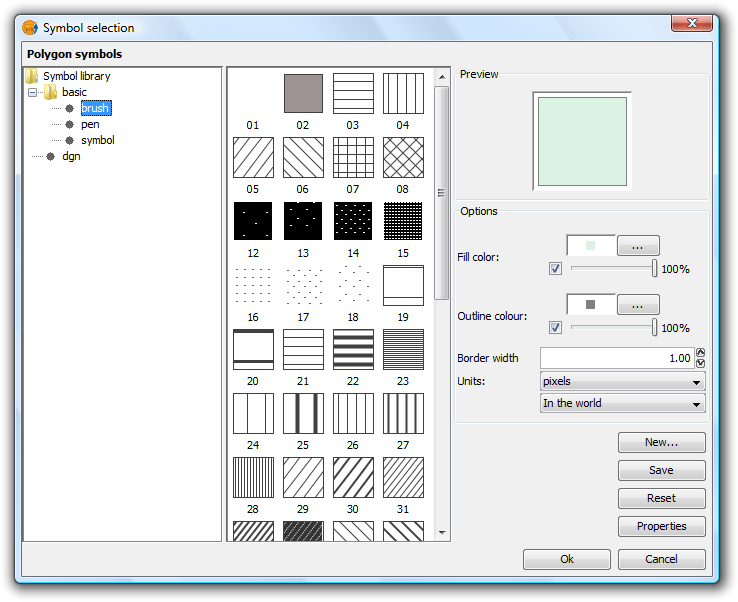
Symbols. Symbol Selector
Outline: You can display an outline with a specified colour and thickness around the bars. Tick the "Show" check box to draw outlines around the bars.
Dimension: Tick the check box to display the bars in 3D. By default the bars are drawn in 2D.
Preview chart: Any changes made are reflected on the chart preview.


